
Forex Analysis Connect Market Drivers With Chart Signals
Fast-moving currency markets can make yesterday's convincing explanation feel outdated before breakfast. Clear forex analysis combines economic drivers, chart evidence, and risk limits so you can form a trading view without assuming you know what happens next.
A central bank announcement can disrupt a trend, while a promising breakout can reverse within minutes. No signal predicts price movements with certainty, but a consistent process helps you separate useful evidence from noise.
Start by understanding what could move each currency, then examine whether price behavior supports that explanation.
Forex analysis: Turn market insights into a clear trading view
Forex analysis is the process of evaluating why one currency might strengthen or weaken against another. Traders usually combine three approaches: fundamental analysis examines economic conditions, technical analysis studies prices, and sentiment analysis considers market positioning and risk appetite.
Each offers different clues. An economic argument might favor a currency, yet its chart could show persistent selling. That disagreement deserves attention rather than an explanation that forces everything to fit.

Track the economic forces behind currency moves
Interest rate expectations are a major currency driver because they affect the relative appeal of holding assets in different currencies. Traders watch the Federal Reserve, European Central Bank (ECB), and other central banks for changes in policy or guidance.
Inflation and employment reports matter partly because they influence those decisions. For example, US Consumer Price Index releases and the monthly Employment Situation report can shift expectations for Federal Reserve policy.
Suppose investors begin expecting fewer US rate cuts while their expectations for ECB policy remain unchanged. Higher expected US yields could support the dollar and pressure EUR/USD lower. However, positioning, growth concerns, or earlier price moves could weaken that response.
The surprise relative to expectations often matters more than whether a headline number looks strong or weak. A rate increase can disappoint markets if traders expected a larger one.
Central bank comments also matter between scheduled meetings. Meanwhile, elections, geopolitical conflicts, and financial stress can alter demand for currencies before economic reports capture the change.
Compare currency strength, sentiment, and the wider trend
Every currency pair expresses a comparison. EUR/USD quotes the dollar value of one euro, so a rising price means the euro is gaining against the dollar.
That doesn't prove the euro is strong everywhere. Compare EUR/USD with EUR/GBP and EUR/JPY to assess whether the move reflects broad euro demand or dollar weakness. Different interest rate expectations and local developments can explain disagreements between those pairs.
Next, examine daily and weekly charts. A short rally inside a sustained weekly decline carries different context than a rally that breaks a long-established range. Match that perspective to your intended holding period.
Sentiment adds another layer. During financial stress, investors may favor liquid currencies such as the US dollar, although its reaction varies with the source of the shock.
The Commodity Futures Trading Commission's Commitments of Traders reports offer positioning information for currency futures. However, these weekly reports aren't a live picture of the entire spot market. Use positioning as context, rather than treating crowded trades as automatic reversal signals.
Read forex chart signals without mistaking them for certainty
Charts show how buyers and sellers have responded to available information. They can help identify a possible setup, but they can't establish what tomorrow's price must be.
Useful forex analysis separates an interesting chart from a decision-ready plan. A recognizable pattern still needs entry conditions, a failure point, and acceptable risk.
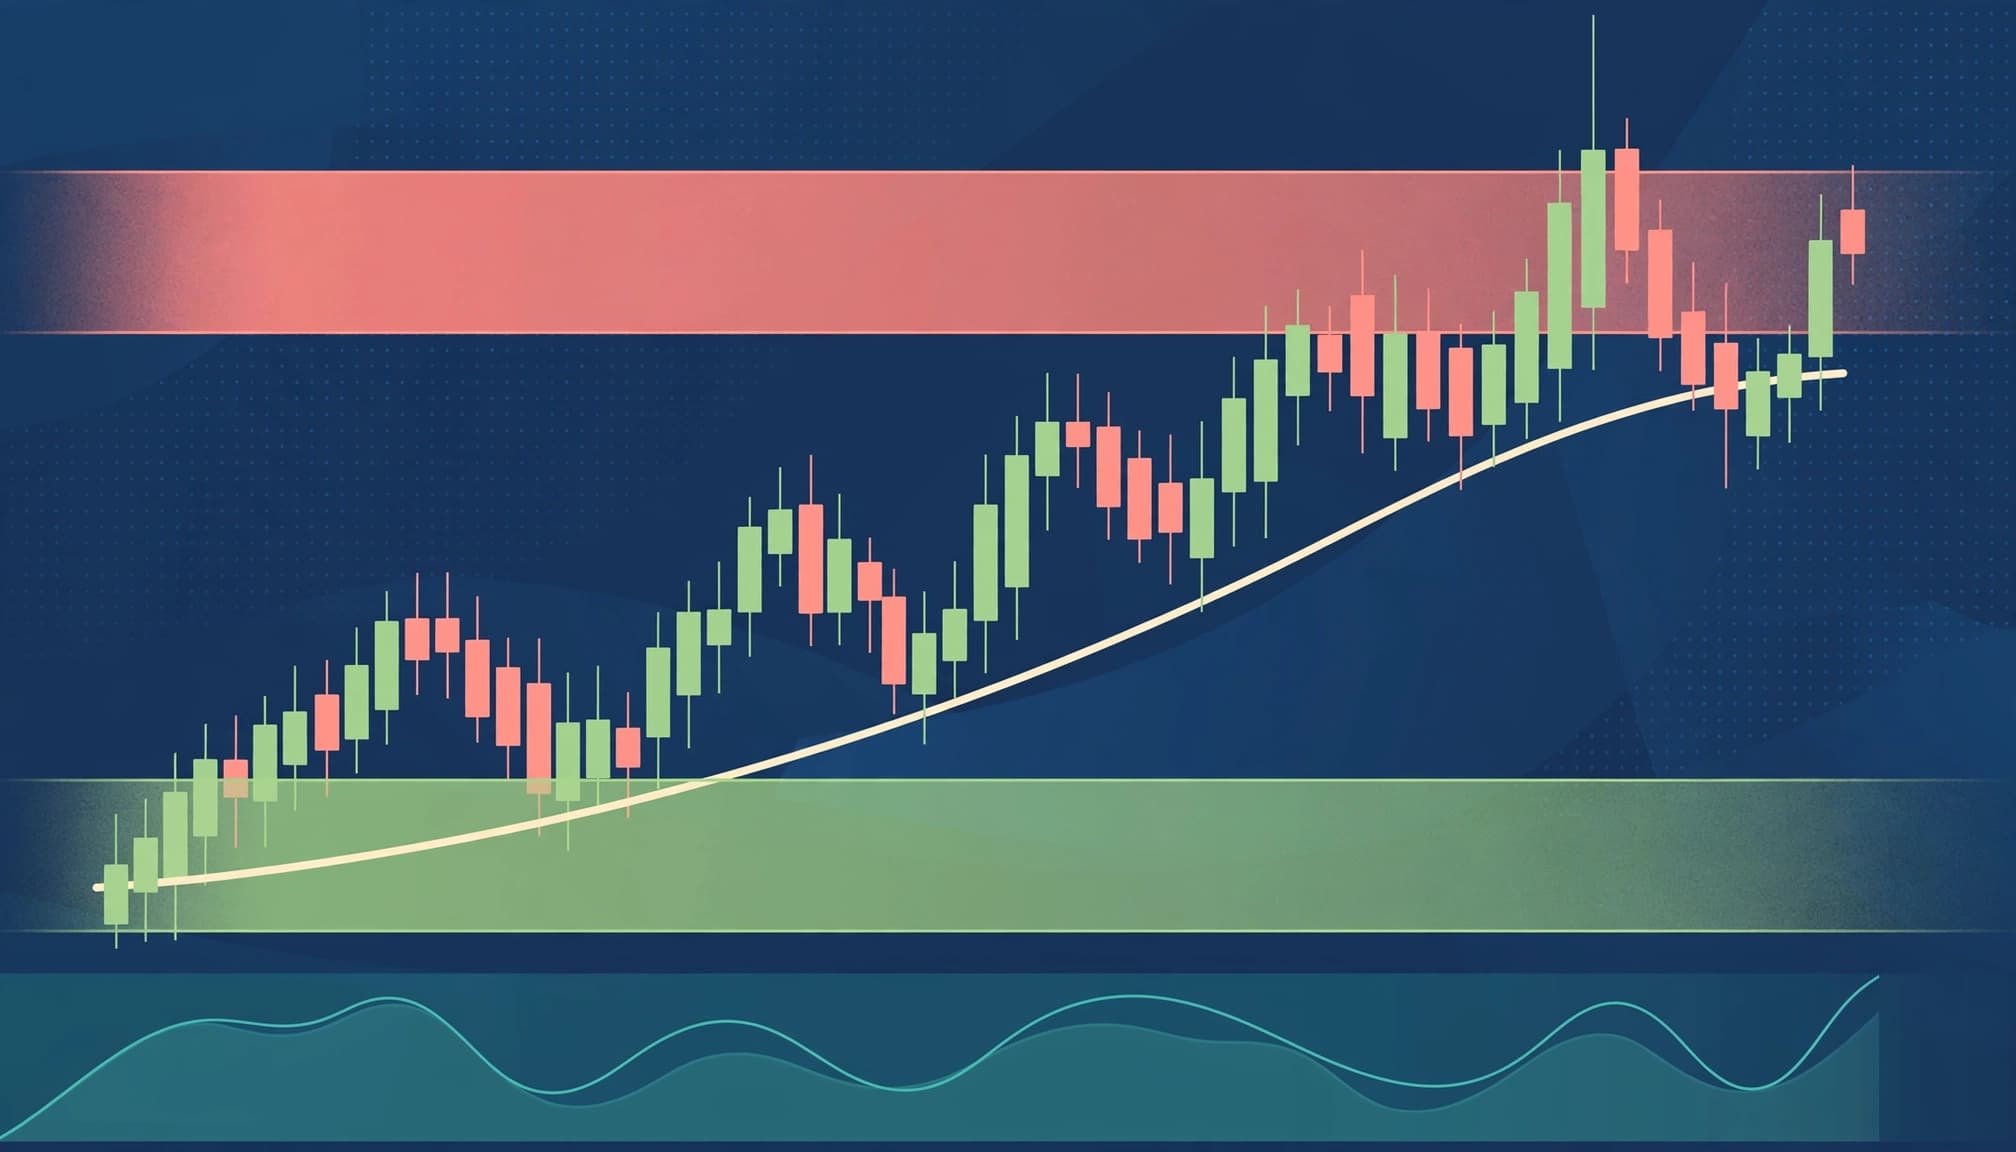
Spot support, resistance, trend lines, and price patterns
Support is an area where buying previously slowed or reversed a decline. Resistance is an area where selling previously interrupted an advance.
Mark price zones, rather than assuming an exact quote will hold. Different participants use different orders and time frames, so reactions rarely occur at one perfectly clean line.
Trend structure provides another clue. Higher swing highs and higher swing lows describe an uptrend; lower highs and lower lows describe a downtrend. A trend line can summarize that structure, but its placement involves judgment.
A breakout occurs when price moves beyond an established boundary. However, a brief push above resistance followed by a close back inside the range may indicate a false breakout.
Some traders wait for a candle to close beyond the zone. Others also look for a retest that holds. Both approaches define evidence to watch, but neither removes uncertainty.
Pullbacks need context too. A retreat toward former resistance during an uptrend may offer a setup, while repeated failures to recover can suggest weakening demand.
Use moving averages, RSI, and volume with care
Moving averages smooth historical prices to make direction easier to see. A 50-day moving average describes a shorter stretch of price history than a 200-day average.
Because moving averages use past prices, their signals lag. Crossovers may arrive after a substantial move, and sideways markets can produce repeated reversals.
The Relative Strength Index (RSI) measures momentum on a scale of zero to 100. A common setting uses 14 periods, with readings above 70 called overbought and readings below 30 called oversold.
Those labels don't mean a reversal is due. During a strong trend, RSI can remain elevated or depressed while price continues in the same direction.
Volume requires extra care in forex because spot trading is decentralized. Many retail platforms display tick volume, which counts price updates on their feed rather than total global trading volume. Exchange-traded currency futures provide centralized volume, but they cover a different market.
Agreement between several price-based indicators isn't independent evidence when they all summarize the same underlying price movement.
Choose indicators that answer distinct questions instead of adding more until the chart appears convincing.
Build a forex analysis plan from signal to risk control
A repeatable plan connects the economic explanation to observable price conditions. It also defines when you should abandon the idea.
The following process is educational, not personalized financial advice. Leveraged forex trading can produce substantial losses, and analysis doesn't eliminate that risk.
Check the pair, time frame, and upcoming news
Start with one pair and a defined holding period. EUR/USD, USD/JPY, and GBP/USD involve different economic drivers, trading behavior, and exposure to scheduled announcements.
Keep your analytical time frames consistent. For example, someone planning around four-hour candles might use the daily chart for broader direction. A weekly trend can provide context without dictating every intraday decision.
Then review the economic calendar for both currencies. For EUR/USD, that includes Federal Reserve and ECB decisions, US employment releases, and inflation reports affecting either economy.
Major releases can cause rapid repricing. Spreads may widen, available liquidity can change, and orders may execute at worse prices than expected.
A chart pattern formed immediately before a major announcement can lose relevance within seconds. Decide beforehand whether your approach allows that event exposure.
Also consider timing. A setup that needs active monitoring may be unsuitable if you can't observe the market during its planned entry window. The plan should fit the time you can realistically commit.
Set an entry idea, an invalidation level, and a risk limit
Define what must happen before entry. "Buy because the euro looks strong" leaves too much room for improvisation. A more testable condition might require a candle close above resistance followed by a retest that holds.
Next, identify invalidation, the price behavior that would undermine your reasoning. Place that level according to the market structure, then calculate whether the resulting risk fits your limit.
Position size depends on the distance between entry and stop, the value of each pip, and the amount you're prepared to lose. A wider stop generally requires a smaller position for the same planned monetary risk.
For most currency pairs, one pip is 0.0001; for yen-quoted pairs, it's typically 0.01. Pip value also depends on position size and your account currency.
Stop-loss orders can help enforce an exit, but they don't guarantee the requested price. Gaps and slippage can make actual losses larger.
Finally, identify a plausible exit area for a favorable move. Compare that potential gain with the planned loss after costs. If the next resistance zone leaves little room, passing on the setup can be a valid decision.
Review a hypothetical EUR/USD setup
This hypothetical example uses invented prices and conditions to illustrate planning. It isn't a current forecast or trade recommendation.
Assume weaker US inflation has reduced expected US interest rates relative to euro-area rates. EUR/USD is also making higher lows on its daily chart, while the four-hour chart shows resistance around 1.0850.
A trader's scenario requires a four-hour close above that zone, followed by a retest that holds. Suppose those conditions occur and the planned entry is 1.0860.
The trader places an invalidation-based stop at 1.0820, below the assumed retest structure. That creates a 40-pip distance between entry and stop.
For a $10,000 US-dollar account, an illustrative 0.5% risk budget equals $50. On EUR/USD, a 12,500-euro position has a pip value of approximately $1.25. A 40-pip loss would therefore equal $50 before trading costs and slippage.
To keep planned risk within $50, the position would need to be smaller to allow for applicable costs. Execution risk still means the final loss could exceed that budget.
Suppose the next chart-based objective is 1.0940. That offers 80 pips of potential upside against 40 pips of planned downside, a 2:1 ratio before costs. The ratio describes the payoff structure, not the probability of success.
If price closes back below the breakout zone before entry, or new information contradicts the rate argument, the trader can cancel the idea. A complete plan includes conditions for staying out.
Conclusion: Make the Reasoning Repeatable
Clear forex analysis starts with the forces affecting both currencies, then tests that explanation against chart behavior. Define risk before entry, including the possibility that execution will differ from your plan.
Record the catalyst, chart conditions, invalidation level, and position size for each setup. Review failed ideas alongside successful ones so you can distinguish a sound process from a fortunate result.
No indicator makes currency markets certain. A useful analysis gives you a reason to act, a reason to wait, and a clear point for reconsidering your view.